2026 SEASON · WEEK 9
← Active players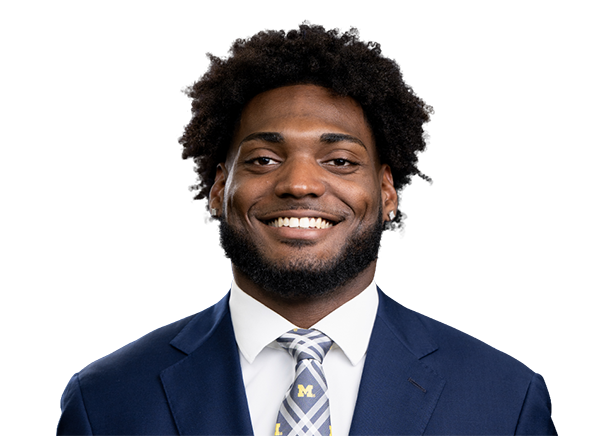
Solo tackles5 Combined tackles25 Sacks2 QB hits3 Pressure rate10.2% INT0 Forced fumbles0 Fumble recoveries0 Tackles for loss4 Passes defended0 Week 10 Same-position context
ACTIVE PLAYER PROFILE
Josaiah Stewart
LB ·  LA · Active
Age 23College Michigan; Coastal CarolinaDepth WLB #2
Next matchup
Current schedule and opponent context
Away · 2026-11-15 · 4:05 PMLA vs ARIState Farm Stadium · Indoors
Matchup rank#12#1 is the easiest opposing offense by EPA/play
CFI history and comparable paths
Qualified weekly form plus the closest same-position index profiles
Josaiah StewartYaya Diaby · comparableYasir Abdullah · comparableTravon Walker · comparable
Weekly CFI history
Same-position percentile grade for each qualifying week in 2026. The season CFI above is the cumulative grade.
| Week | Weekly CFI | Rank | Qualified players | Volume |
|---|---|---|---|---|
| 1 | 39.2 | #63 | 91 | 28 |
| 2 | 54.2 | #38 | 83 | 46 |
| 3 | 46.8 | #49 | 87 | 52 |
| 4 | 27.3 | #79 | 87 | 32 |
| 5 | 59.1 | #25 | 86 | 52 |
| 6 | 48.1 | #40 | 78 | 55 |
| 7 | 32.7 | #57 | 73 | 47 |
| 8 | 70.6 | #12 | 80 | 34 |
| 9 | 54.3 | #33 | 82 | 30 |
Advanced Player Research
Production, usage, efficiency, and indexes for 2026
Performance · 2026
Advanced efficiency
defense
- Pressure rate
- 10.17%
- Pass rush win rate
- 12.66%
- Run stop rate
- 7.63%
- Sacks / pass rush
- 1.13%
- Hits / pass rush
- 1.13%
- Hurries / pass rush
- 7.91%
- Missed tackle rate
- 17.24%
- Defensive grade
- 58.53
- Pass rush grade
- 59.31
- Run defense grade
- 59.97
- Coverage grade
- 58.27
- Pressures
- 18
- Charted sacks
- 2
- Charted QB hits
- 2
- QB hurries
- 14
- Batted passes
- 0
- Run stops
- 10
- Charted solo tackles
- 17
- Charted assists
- 7
- Missed tackles
- 5
- Defensive snaps
- 376
- Pass rush snaps
- 177
- Run defense snaps
- 137
Core indexes · experimental v1.4
Weekly game log
| Week | Solo tackles | Combined tackles | Sacks | QB hits | Pressure rate | INT | Forced fumbles | Fumble recoveries | Tackles for loss | Passes defended |
|---|---|---|---|---|---|---|---|---|---|---|
| 1 | 2 | 6 | 0 | 1 | 10% | 0 | 0 | 0 | 0 | 0 |
| 2 | 0 | 1 | 0 | 0 | 10.7% | 0 | 0 | 0 | 0 | 0 |
| 3 | 0 | 2 | 0 | 0 | 9.1% | 0 | 0 | 0 | 0 | 0 |
| 4 | 0 | 1 | 0 | 0 | 0% | 0 | 0 | 0 | 0 | 0 |
| 5 | 1 | 3 | 1 | 1 | 15.8% | 0 | 0 | 0 | 1 | 0 |
| 6 | 1 | 5 | 0 | 0 | 9.1% | 0 | 0 | 0 | 1 | 0 |
| 7 | — | — | — | — | 6.9% | — | — | — | — | — |
| 8 | 1 | 6 | 1 | 1 | 25% | 0 | 0 | 0 | 2 | 0 |
| 9 | 0 | 1 | 0 | 0 | 7.1% | 0 | 0 | 0 | 0 | 0 |
Home and away
Production by game setting
| Split | Games | Solo tackles | Combined tackles | Sacks | QB hits | Pressure rate | INT | Forced fumbles | Fumble recoveries | Tackles for loss | Passes defended |
|---|---|---|---|---|---|---|---|---|---|---|---|
| Home | 5 | 5 | 21 | 2 | 3 | 13.7% | 0 | 0 | 0 | 4 | 0 |
| Away | 4 | 0 | 4 | 0 | 0 | 6.1% | 0 | 0 | 0 | 0 | 0 |
Indoor and outdoor
Production by game setting
| Split | Games | Solo tackles | Combined tackles | Sacks | QB hits | Pressure rate | INT | Forced fumbles | Fumble recoveries | Tackles for loss | Passes defended |
|---|---|---|---|---|---|---|---|---|---|---|---|
| Indoor | 6 | 5 | 21 | 2 | 3 | 12.1% | 0 | 0 | 0 | 4 | 0 |
| Outdoor | 3 | 0 | 4 | 0 | 0 | 5.7% | 0 | 0 | 0 | 0 | 0 |
Temperature
Production by game setting
| Split | Games | Solo tackles | Combined tackles | Sacks | QB hits | Pressure rate | INT | Forced fumbles | Fumble recoveries | Tackles for loss | Passes defended |
|---|---|---|---|---|---|---|---|---|---|---|---|
| 40–69°FSmall sample | 2 | 0 | 2 | 0 | 0 | 3.2% | 0 | 0 | 0 | 0 | 0 |
| 70°F and aboveSmall sample | 1 | 0 | 2 | 0 | 0 | 9.1% | 0 | 0 | 0 | 0 | 0 |
Wind
Production by game setting
| Split | Games | Solo tackles | Combined tackles | Sacks | QB hits | Pressure rate | INT | Forced fumbles | Fumble recoveries | Tackles for loss | Passes defended |
|---|---|---|---|---|---|---|---|---|---|---|---|
| Below 10 mphSmall sample | 1 | 0 | 1 | 0 | 0 | 0% | 0 | 0 | 0 | 0 | 0 |
| 10 mph and aboveSmall sample | 2 | 0 | 3 | 0 | 0 | 8.3% | 0 | 0 | 0 | 0 | 0 |
Opponent history
Performance against opponents across imported seasons
| Opponent | Games | Solo tackles | Combined tackles | Sacks | QB hits | Pressure rate | INT | Forced fumbles | Fumble recoveries | Tackles for loss | Passes defended | Last meeting |
|---|---|---|---|---|---|---|---|---|---|---|---|---|
| HOUSmall sample | 1 | 0 | 0 | 0 | 0 | — | 0 | 0 | 0 | 0 | 1 | 2025-09-07 |
| TENSmall sample | 1 | 2 | 2 | 1 | 2 | — | 0 | 0 | 0 | 1 | 0 | 2025-09-14 |
| PHISmall sample | 2 | 0 | 1 | 0 | 0 | 0% | 0 | 0 | 0 | 0 | 0 | 2026-10-04 |
| INDSmall sample | 1 | 1 | 1 | 0 | 0 | — | 0 | 0 | 0 | 0 | 0 | 2025-09-28 |
| SF | 3 | 2 | 8 | 0 | 1 | 10% | 0 | 0 | 0 | 0 | 1 | 2026-09-10 |
| BALSmall sample | 1 | 1 | 3 | 0 | 0 | — | 0 | 0 | 0 | 0 | 0 | 2025-10-12 |
| JAXSmall sample | 1 | 2 | 2 | 1 | 2 | — | 0 | 0 | 0 | 1 | 0 | 2025-10-19 |
| NOSmall sample | 1 | 0 | 1 | 0 | 0 | — | 0 | 0 | 0 | 0 | 0 | 2025-11-02 |
| SEASmall sample | 2 | 1 | 3 | 0 | 0 | — | 0 | 0 | 0 | 0 | 0 | 2025-12-18 |
| TBSmall sample | 1 | 1 | 2 | 0 | 1 | — | 0 | 0 | 0 | 0 | 0 | 2025-11-23 |
| CARSmall sample | 1 | 1 | 2 | 0 | 0 | — | 0 | 0 | 0 | 0 | 0 | 2025-11-30 |
| ARI | 3 | 3 | 7 | 1 | 1 | 9.1% | 0 | 1 | 0 | 2 | 0 | 2026-10-18 |
| DETSmall sample | 1 | 1 | 2 | 0 | 0 | — | 0 | 0 | 0 | 0 | 0 | 2025-12-14 |
| ATLSmall sample | 1 | — | — | — | — | — | — | — | — | — | — | 2025-12-29 |
| NYGSmall sample | 1 | 0 | 1 | 0 | 0 | 10.7% | 0 | 0 | 0 | 0 | 0 | 2026-09-21 |
| DENSmall sample | 1 | 0 | 2 | 0 | 0 | 9.1% | 0 | 0 | 0 | 0 | 0 | 2026-09-27 |
| BUFSmall sample | 1 | 1 | 3 | 1 | 1 | 15.8% | 0 | 0 | 0 | 1 | 0 | 2026-10-12 |
| LVSmall sample | 1 | — | — | — | — | 6.9% | — | — | — | — | — | 2026-10-25 |
| LACSmall sample | 1 | 1 | 6 | 1 | 1 | 25% | 0 | 0 | 0 | 2 | 0 | 2026-11-01 |
| WASSmall sample | 1 | 0 | 1 | 0 | 0 | 7.1% | 0 | 0 | 0 | 0 | 0 | 2026-11-08 |
Game log
Location, game environment, workload, and production
| Season | Week | Opponent | Site | Environment | Solo tackles | Combined tackles | Sacks | QB hits | Pressure rate | INT | Forced fumbles | Fumble recoveries | Tackles for loss | Passes defended |
|---|---|---|---|---|---|---|---|---|---|---|---|---|---|---|
| 2026 | 1 | SF | Home | Indoor · 57° | 2 | 6 | 0 | 1 | 10% | 0 | 0 | 0 | 0 | 0 |
| 2026 | 2 | NYG | Home | Indoor | 0 | 1 | 0 | 0 | 10.7% | 0 | 0 | 0 | 0 | 0 |
| 2026 | 3 | DEN | Away | Outdoor · 83° | 0 | 2 | 0 | 0 | 9.1% | 0 | 0 | 0 | 0 | 0 |
| 2026 | 4 | PHI | Away | Outdoor · 62° | 0 | 1 | 0 | 0 | 0% | 0 | 0 | 0 | 0 | 0 |
| 2026 | 5 | BUF | Home | Indoor | 1 | 3 | 1 | 1 | 15.8% | 0 | 0 | 0 | 1 | 0 |
| 2026 | 6 | ARI | Home | Indoor | 1 | 5 | 0 | 0 | 9.1% | 0 | 0 | 0 | 1 | 0 |
| 2026 | 7 | LV | Away | Indoor | — | — | — | — | 6.9% | — | — | — | — | — |
| 2026 | 8 | LAC | Home | Indoor | 1 | 6 | 1 | 1 | 25% | 0 | 0 | 0 | 2 | 0 |
| 2026 | 9 | WAS | Away | Outdoor · 61° | 0 | 1 | 0 | 0 | 7.1% | 0 | 0 | 0 | 0 | 0 |
Career totals
Regular-season totals across available career history
| Season | Team | Games | Solo tackles | Combined tackles | Sacks | QB hits | Pressure rate | INT | Forced fumbles | Fumble recoveries | Tackles for loss | Passes defended |
|---|---|---|---|---|---|---|---|---|---|---|---|---|
| 2025 | LA | 17 | 12 | 22 | 3 | 6 | — | 0 | 1 | 0 | 3 | 2 |
| 2026 | LA | 9 | 5 | 25 | 2 | 3 | 10.2% | 0 | 0 | 0 | 4 | 0 |
| Career | All teams | 26 | 17 | 47 | 5 | 9 | 10.2% | 0 | 1 | 0 | 7 | 2 |
Weekly CFI is a same-position percentile grade using the published weekly play and production fields. CFI uses the same position model as the leaderboard. A dash means the source data or a qualified model is unavailable. Historical production is from nflverse; charted blocking and pressure metrics cover published charting reports only. Missing values are left blank rather than estimated.