2026 SEASON · WEEK 9
← Active players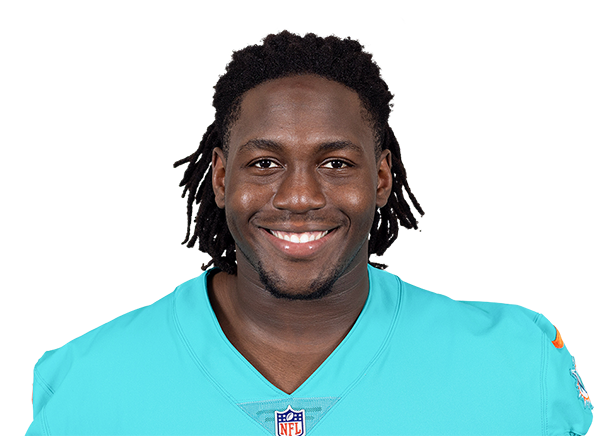
Offensive snaps480 Pass block snaps276 Run block snaps203 Pass block grade70.7 Run block grade56.5 Sacks allowed3 Pressures allowed22 Penalties5 Week 10 Same-position context
ACTIVE PLAYER PROFILE
Patrick Paul
OL ·  MIA · Active
Age 25College HoustonDepth LT #1
Next matchup
Current schedule and opponent context
Away · 2026-11-15 · 1:00 PMMIA vs INDLucas Oil Stadium · Indoors
Matchup rank#6#1 is the easiest opposing defense by EPA allowed/play
CFI history and comparable paths
Qualified weekly form plus the closest same-position index profiles
Patrick PaulJoshua Ezeudu · comparableJalen Travis · comparableMax Iheanachor · comparable
Weekly CFI history
Same-position percentile grade for each qualifying week in 2026. The season CFI above is the cumulative grade.
| Week | Weekly CFI | Rank | Qualified players | Volume |
|---|---|---|---|---|
| 1 | 43.8 | #36 | 64 | 55 |
| 2 | 70.9 | #14 | 65 | 59 |
| 3 | 61.7 | #21 | 64 | 73 |
| 4 | 39.6 | #44 | 67 | 39 |
| 5 | 25.8 | #56 | 62 | 66 |
| 7 | 25.6 | #50 | 57 | 65 |
| 8 | 73.7 | #9 | 56 | 65 |
| 9 | 13.4 | #55 | 55 | 57 |
Advanced Player Research
Production, usage, efficiency, and indexes for 2026
Performance · 2026
Advanced efficiency
blocking
- Pass block grade
- 70.74
- Run block grade
- 56.53
- Pressure allowed rate
- 7.97%
- Sacks allowed / pass block
- 1.09%
- Hits allowed / pass block
- 0.36%
- Hurries allowed / pass block
- 6.52%
- Sacks allowed
- 3
- Hits allowed
- 1
- Hurries allowed
- 18
- Pressures allowed
- 22
- Penalties
- 5
- Offensive snaps
- 480
- Pass block snaps
- 276
- Run block snaps
- 203
Core indexes · experimental v1.4
Weekly game log
| Week | Offensive snaps | Pass block snaps | Run block snaps | Pass block grade | Run block grade | Sacks allowed | Pressures allowed | Penalties |
|---|---|---|---|---|---|---|---|---|
| 1 | 56 | 40 | 15 | 76.4 | 64.6 | 1 | 4 | 1 |
| 2 | 59 | 31 | 28 | 82 | 69.1 | 0 | 1 | 0 |
| 3 | 73 | 46 | 27 | 77.7 | 59.1 | 0 | 1 | 0 |
| 4 | 39 | 20 | 19 | 68.6 | 54.3 | 0 | 2 | 2 |
| 5 | 66 | 35 | 31 | 49.8 | 54.7 | 1 | 4 | 0 |
| 7 | 65 | 27 | 38 | 68.9 | 37.3 | 1 | 3 | 1 |
| 8 | 65 | 40 | 25 | 84 | 74.5 | 0 | 2 | 1 |
| 9 | 57 | 37 | 20 | 54.5 | 48.4 | 0 | 5 | 0 |
Home and away
Production by game setting
| Split | Games | Offensive snaps | Pass block snaps | Run block snaps | Pass block grade | Run block grade | Sacks allowed | Pressures allowed | Penalties |
|---|
Game setting data is unavailable for this selection.
Indoor and outdoor
Production by game setting
| Split | Games | Offensive snaps | Pass block snaps | Run block snaps | Pass block grade | Run block grade | Sacks allowed | Pressures allowed | Penalties |
|---|
Game setting data is unavailable for this selection.
Temperature
Production by game setting
| Split | Games | Offensive snaps | Pass block snaps | Run block snaps | Pass block grade | Run block grade | Sacks allowed | Pressures allowed | Penalties |
|---|
Game setting data is unavailable for this selection.
Wind
Production by game setting
| Split | Games | Offensive snaps | Pass block snaps | Run block snaps | Pass block grade | Run block grade | Sacks allowed | Pressures allowed | Penalties |
|---|
Game setting data is unavailable for this selection.
Opponent history
Performance against opponents across imported seasons
| Opponent | Games | Offensive snaps | Pass block snaps | Run block snaps | Pass block grade | Run block grade | Sacks allowed | Pressures allowed | Penalties | Last meeting |
|---|---|---|---|---|---|---|---|---|---|---|
| JAXSmall sample | 1 | 0 | — | — | — | — | — | — | — | 2024-09-08 |
| BUF | 4 | 114 | — | — | — | — | — | — | — | 2025-11-09 |
| SEASmall sample | 1 | 1 | — | — | — | — | — | — | — | 2024-09-22 |
| TENSmall sample | 1 | 60 | — | — | — | — | — | — | — | 2024-09-30 |
| NE | 5 | 197 | 40 | 25 | 84 | 74.5 | 0 | 2 | 4 | 2026-01-04 |
| INDSmall sample | 2 | 48 | — | — | — | — | — | — | — | 2025-09-07 |
| ARISmall sample | 1 | 0 | — | — | — | — | — | — | — | 2024-10-27 |
| LASmall sample | 1 | 2 | — | — | — | — | — | — | — | 2024-11-11 |
| LVSmall sample | 2 | 56 | 40 | 15 | 76.4 | 64.6 | 1 | 4 | 1 | 2024-11-17 |
| GBSmall sample | 1 | 17 | — | — | — | — | — | — | — | 2024-11-28 |
| NYJ | 4 | 260 | — | — | — | — | — | — | 4 | 2025-12-07 |
| HOUSmall sample | 1 | 68 | — | — | — | — | — | — | — | 2024-12-15 |
| SFSmall sample | 1 | 0 | — | — | — | — | — | — | — | 2024-12-22 |
| CLESmall sample | 2 | 91 | — | — | — | — | — | — | — | 2025-10-19 |
| CARSmall sample | 1 | 55 | — | — | — | — | — | — | — | 2025-10-05 |
| LACSmall sample | 1 | 57 | — | — | — | — | — | — | — | 2025-10-12 |
| ATLSmall sample | 1 | 62 | — | — | — | — | — | — | 2 | 2025-10-26 |
| BALSmall sample | 1 | 64 | — | — | — | — | — | — | — | 2025-10-30 |
| WASSmall sample | 1 | 56 | — | — | — | — | — | — | — | 2025-11-16 |
| NOSmall sample | 1 | 60 | — | — | — | — | — | — | — | 2025-11-30 |
| PITSmall sample | 1 | 50 | — | — | — | — | — | — | — | 2025-12-15 |
| CINSmall sample | 1 | 59 | — | — | — | — | — | — | — | 2025-12-21 |
| TBSmall sample | 1 | 55 | — | — | — | — | — | — | 1 | 2025-12-28 |
| MINSmall sample | 1 | 39 | 20 | 19 | 68.6 | 54.3 | 0 | 2 | 2 | — |
Game log
Location, game environment, workload, and production
| Season | Week | Opponent | Site | Environment | Offensive snaps | Pass block snaps | Run block snaps | Pass block grade | Run block grade | Sacks allowed | Pressures allowed | Penalties |
|---|---|---|---|---|---|---|---|---|---|---|---|---|
| 2026 | 1 | LV | — | — | 56 | 40 | 15 | 76.4 | 64.6 | 1 | 4 | 1 |
| 2026 | 2 | — | — | — | 59 | 31 | 28 | 82 | 69.1 | 0 | 1 | 0 |
| 2026 | 3 | — | — | — | 73 | 46 | 27 | 77.7 | 59.1 | 0 | 1 | 0 |
| 2026 | 4 | MIN | — | — | 39 | 20 | 19 | 68.6 | 54.3 | 0 | 2 | 2 |
| 2026 | 5 | — | — | — | 66 | 35 | 31 | 49.8 | 54.7 | 1 | 4 | 0 |
| 2026 | 7 | — | — | — | 65 | 27 | 38 | 68.9 | 37.3 | 1 | 3 | 1 |
| 2026 | 8 | NE | — | — | 65 | 40 | 25 | 84 | 74.5 | 0 | 2 | 1 |
| 2026 | 9 | — | — | — | 57 | 37 | 20 | 54.5 | 48.4 | 0 | 5 | 0 |
Career totals
Regular-season totals across available career history
| Season | Team | Games | Offensive snaps | Pass block snaps | Run block snaps | Pass block grade | Run block grade | Sacks allowed | Pressures allowed | Penalties |
|---|---|---|---|---|---|---|---|---|---|---|
| 2024 | MIA | 17 | 337 | — | — | — | — | — | — | 2 |
| 2025 | MIA | 17 | 974 | — | — | — | — | — | — | 8 |
| 2026 | MIA | 8 | 480 | 276 | 203 | 70.7 | 56.5 | 3 | 22 | 5 |
| Career | All teams | 42 | 1,791 | 276 | 203 | 70.7 | 56.5 | 3 | 22 | 15 |
Weekly CFI is a same-position percentile grade using the published weekly play and production fields. CFI uses the same position model as the leaderboard. A dash means the source data or a qualified model is unavailable. Historical production is from nflverse; charted blocking and pressure metrics cover published charting reports only. Missing values are left blank rather than estimated.